Training Graph Neural Networks with 1000 Layers
Abstract
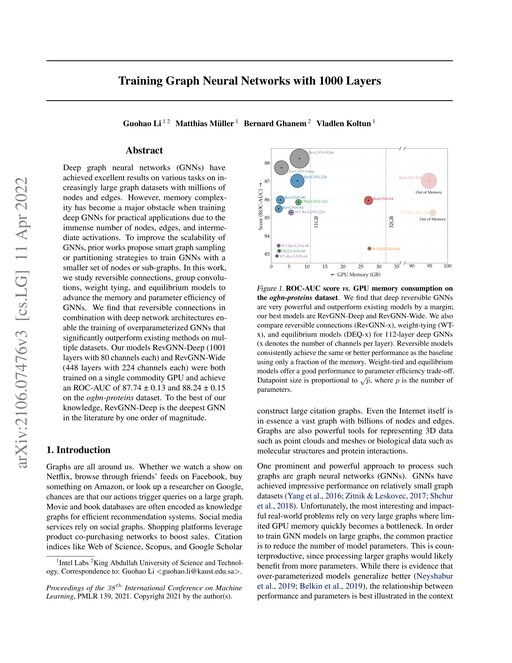
Deep graph neural networks (GNNs) have achieved excellent results on various tasks on increasingly large graph datasets with millions of nodes and edges. However, memory complexity has become a major obstacle when training deep GNNs for practical applications due to the immense number of nodes, edges, and intermediate activations. To improve the scalability of GNNs, prior works propose smart graph sampling or partitioning strategies to train GNNs with a smaller set of nodes or sub-graphs. In this work, we study reversible connections, group convolutions, weight tying, and equilibrium models to advance the memory and parameter efficiency of GNNs. We find that reversible connections in combination with deep network architectures enable the training of overparameterized GNNs that significantly outperform existing methods on multiple datasets. Our models RevGNN-Deep (1001 layers with 80 channels each) and RevGNN-Wide (448 layers with 224 channels each) were both trained on a single commodity GPU and achieve an ROC-AUC of 87.74 ± 0.13 and 88.24 ± 0.15 on the ogbn-proteins dataset. To the best of our knowledge, RevGNN-Deep is the deepest GNN in the literature by one order of magnitude.
Benchmark Results
Tested on 1 dataset
Tables show presented results in global context (best 3 papers + GCN + MLP).
OGB
| # | Model | ROC-AUC ↑ | Paper |
|---|---|---|---|
| 1 | LD | 0.8942
±0.0007 | |
| 2 | X_WO/LD | 0.8915
±0.0012 | |
| 3 | X_PNE | 0.8894
±0.0014 | |
| 6 | RevGNN | 0.8824
±0.0015 | This paper |
| 7 | RevGNN-Deep | 0.8774
±0.0013 | This paper |
| 8 | UniMP+CEF | 0.8691
±0.0018 | This paper |
| 9 | GAT | 0.8682
±0.0021 | This paper |
| 11 | DeeperGCN | 0.8616
±0.0016 | prev best: Masked Label Prediction: Unified Message Passing Model for Semi-Supervised Classification (IJCAI 2020) |
| 16 | GraphSAGE | 0.8430 best reported | |
| 17 | GCN | 0.8320 best reported | |
| 29 | SAGE | 0.7943
±0.0075 |