Geometry Contrastive Learning on Heterogeneous Graphs
Abstract
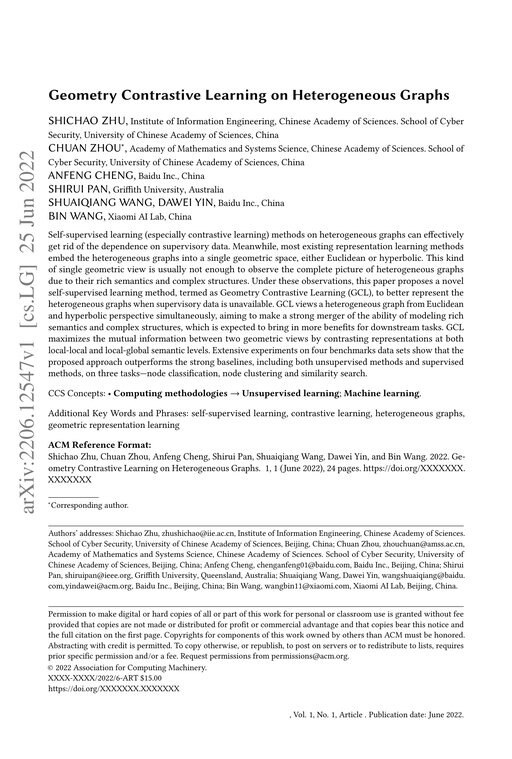
Self-supervised learning (especially contrastive learning) methods on heterogeneous graphs can effectively get rid of the dependence on supervisory data. Meanwhile, most existing representation learning methods embed the heterogeneous graphs into a single geometric space, either Euclidean or hyperbolic. This kind of single geometric view is usually not enough to observe the complete picture of heterogeneous graphs due to their rich semantics and complex structures. Under these observations, this paper proposes a novel self-supervised learning method, termed as Geometry Contrastive Learning (GCL), to better represent the heterogeneous graphs when supervisory data is unavailable. GCL views a heterogeneous graph from Euclidean and hyperbolic perspective simultaneously, aiming to make a strong merger of the ability of modeling rich semantics and complex structures, which is expected to bring in more benefits for downstream tasks. GCL maximizes the mutual information between two geometric views by contrasting representations at both local-local and local-global semantic levels. Extensive experiments on four benchmarks data sets show that the proposed approach outperforms the strong baselines, including both unsupervised methods and supervised methods, on three tasks—node classification, node clustering and similarity search.
Benchmark Results
Tested on 4 datasets 14 baseline values reported too low Non-standard metric on 1 dataset
Tables show presented results in global context (best 3 papers + GCN + MLP).
Heterogeneous Graph Benchmarks
| # | Model | Micro-F1 ↑ | Paper |
|---|---|---|---|
| 1 | LMSPS | 0.9566
±0.0020 | |
| 2 | PSHGCN | 0.9561
±0.0012 | |
| 3 | RpHGNN | 0.9555
±0.0029 | |
| 21 | GCN | 0.9460
±0.0031 best reported | best at pub: Leveraging Meta-path Contexts for Classification in Heterogeneous Information Networks (2020) best today: Graph Neural Networks with a Distribution of Parametrized Graphs (ICML 2023) |
| 23 | GAT | 0.9448
±0.0022 best reported | best at pub: Heterogeneous Graph Benchmarks (KDD 2021) best today: Graph Neural Networks with a Distribution of Parametrized Graphs (ICML 2023) |
| 37 | HAN | 0.9369 best reported | |
| 44 | DMGI | 0.7850
±0.0105 | prev best: Implicit Graph Neural Networks (NeurIPS 2020) |
| 46 | GraphSAGE | 0.9306
±0.0047 | |
| 50 | MVGRL | 0.9289 best reported | |
| 52 | Node2Vec | 0.9282 best reported | |
| 61 | HDGI | 0.9233 best reported | |
| 74 | GRACE | 0.7113
±0.0132 | prev best: Mixed Graph Contrastive Network for Semi-Supervised Node Classification (2022) best today: Heterogeneous Graph Contrastive Multi-view Learning (2022) |
| 79 | DGI | 0.7378
±0.0151 | prev best: Implicit Graph Neural Networks (NeurIPS 2020) best today: Heterogeneous Graph Contrastive Multi-view Learning (2022) Improvement within reported uncertainty; not highlighted. |
| 81 | DeepWalk | 0.9012
±0.0045 best reported | best at pub: Implicit Graph Neural Networks (NeurIPS 2020) best today: Generative-Contrastive Heterogeneous Graph Neural Network (2024) |
| 89 | R-GCN | 0.8700
±0.0070 best reported | best today: Multiplex Heterogeneous Graph Convolutional Network (KDD 2022) |
| 136 | GCL | 0.8027
±0.0136 | This paper |
| 166 | MGCN | 0.7130 best reported | best at pub: Implicit Graph Neural Networks (NeurIPS 2020) Difference within reported uncertainty; not counted as underperformance. |
| 176 | MLP | 0.6447
±0.0136 | |
| 187 | Raw features | 0.5170
±0.0069 | This paper |
| # | Model | Micro-F1 ↑ | Paper |
|---|---|---|---|
| 1 | LMSPS | 0.9469
±0.0036 | |
| 2 | PSHGCN | 0.9427
±0.0023 | |
| 3 | SlotGAT | 0.9406
±0.0022 | |
| 19 | GAT | 0.9273 best reported | best at pub: Self-supervised Auxiliary Learning with Meta-paths for Heterogeneous Graphs (NeurIPS 2020) |
| 29 | GCN | 0.9229 best reported | best at pub: Self-supervised Auxiliary Learning with Meta-paths for Heterogeneous Graphs (NeurIPS 2020) |
| 43 | HAN | 0.9147
±0.0022 best reported | best at pub: Heterogeneous Graph Benchmarks (KDD 2021) best today: Beyond Redundancy: Information-aware Unsupervised Multiplex Graph Structure Learning (NeurIPS 2024) |
| 49 | GIN | 0.9092 | |
| 56 | GCL | 0.9051
±0.0081 | This paper |
| 64 | DMGI | 0.8980
±0.0010 best reported | best at pub: Implicit Graph Neural Networks (NeurIPS 2020) best today: Revisiting Self-Supervised Heterogeneous Graph Learning from Spectral Clustering Perspective (NeurIPS 2024) Difference within reported uncertainty; not counted as underperformance. |
| 66 | HDGI | 0.8930
±0.0142 | This paper |
| 74 | DGI | 0.8844
±0.0030 best reported | best at pub: Implicit Graph Neural Networks (NeurIPS 2020) best today: Heterogeneous Graph Contrastive Multi-view Learning (2022) Difference within reported uncertainty; not counted as underperformance. |
| 79 | MVGRL | 0.8803
±0.0138 | prev best: Mixed Graph Contrastive Network for Semi-Supervised Node Classification (2022) |
| 81 | MGCN | 0.8788
±0.0054 best reported | best at pub: Mixed Graph Contrastive Network for Semi-Supervised Node Classification (2022) |
| 84 | GRACE | 0.8764
±0.0031 best reported | best at pub: Mixed Graph Contrastive Network for Semi-Supervised Node Classification (2022) best today: Heterogeneous Graph Contrastive Multi-view Learning (2022) |
| 91 | R-GCN | 0.8608
±0.0025 | This paper |
| 100 | DeepWalk | 0.7489
±0.0053 | prev best: Implicit Graph Neural Networks (NeurIPS 2020) best today: Heterogeneous Graph Contrastive Multi-view Learning (2022) Improvement within reported uncertainty; not highlighted. |
| 105 | Node2Vec | 0.7488
±0.0056 | This paper |
| 108 | Raw features | 0.7213
±0.0045 | This paper |
| 109 | MLP | 0.7102
±0.0221 |
| # | Model | Micro-F1 ↑ | Paper |
|---|---|---|---|
| 1 | ELLA | 0.7930
±0.0010 | |
| 2 | MHGCN | 0.7820
±0.0138 | |
| 3 | PSHGCN | 0.7446
±0.0032 | |
| 14 | GCN | 0.6813
±0.0083 best reported | best at pub: Heterogeneous Graph Benchmarks (KDD 2021) best today: Spectral Heterogeneous Graph Convolutions via Positive Noncommutative Polynomials (WWW 2023) |
| 15 | GAT | 0.6808
±0.0049 best reported | best at pub: Heterogeneous Graph Benchmarks (KDD 2021) best today: Spectral Heterogeneous Graph Convolutions via Positive Noncommutative Polynomials (WWW 2023) |
| 18 | HAN | 0.6769
±0.0064 best reported | best at pub: Heterogeneous Graph Benchmarks (KDD 2021) best today: Spectral Heterogeneous Graph Convolutions via Positive Noncommutative Polynomials (WWW 2023) |
| 32 | GCL | 0.6514
±0.0047 | This paper |
| 33 | DMGI | 0.6480 best reported | best at pub: Implicit Graph Neural Networks (NeurIPS 2020) best today: Relational Self-Supervised Learning on Graphs (2022) Difference within reported uncertainty; not counted as underperformance. |
| 37 | GRACE | 0.6407
±0.0080 | This paper |
| 43 | MGCN | 0.6308
±0.0038 | prev best: Implicit Graph Neural Networks (NeurIPS 2020) Improvement within reported uncertainty; not highlighted. |
| 44 | GraphSAGE | 0.6276 | |
| 47 | R-GCN | 0.6214
±0.0066 | This paper |
| 51 | HDGI | 0.6083
±0.0089 | This paper |
| 54 | DGI | 0.6060 best reported | best at pub: Implicit Graph Neural Networks (NeurIPS 2020) |
| 59 | MVGRL | 0.5930
±0.0093 | This paper |
| 65 | Raw features | 0.5706
±0.0070 | This paper |
| 68 | DeepWalk | 0.5636
±0.0033 best reported | best at pub: Implicit Graph Neural Networks (NeurIPS 2020) best today: Heterogeneous Graph Contrastive Multi-view Learning (2022) |
| 74 | MLP | 0.5514 | |
| 75 | Node2Vec | 0.5476
±0.0063 | This paper |
Other Graph Benchmarks
Amazon2M
Global leaderboard →Sorted by Macro-F1. Highlighted rows are from other papers.
| # | Model | Macro-F1 ↑ | Paper |
|---|---|---|---|
| 1 | GCL | 0.7650
±0.0122 | This paper |
| 2 | DMGI | 0.7469
±0.0112 | This paper |
| 3 | Raw features | 0.7030
±0.0075 | This paper |
| 4 | GRACE | 0.6707
±0.0139 | This paper |
| 5 | DeepWalk | 0.6631
±0.0079 | This paper |
| 6 | Node2Vec | 0.6621
±0.0077 | This paper |
| 7 | MGCN | 0.6592
±0.0046 | This paper |
| 8 | R-GCN | 0.6401
±0.0120 | This paper |
| 9 | GCN | 0.6360
±0.0095 | This paper |
| 10 | HAN | 0.5343
±0.0080 | This paper |
| 11 | GAT | 0.5193
±0.0036 | This paper |
| 12 | HDGI | 0.4293
±0.0184 | This paper |
| 13 | DGI | 0.4028
±0.0141 | This paper |
| 14 | MVGRL | 0.3838
±0.0135 | This paper |