You Can Have Better Graph Neural Networks by Not Training Weights at All: Finding Untrained GNNs Tickets
Abstract
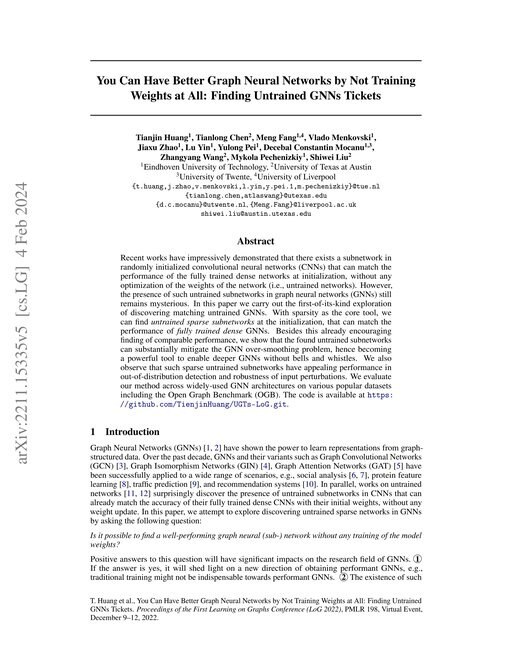
Recent works have impressively demonstrated that there exists a subnetwork in randomly initialized convolutional neural networks (CNNs) that can match the performance of the fully trained dense networks at initialization, without any optimization of the weights of the network (i.e., untrained networks). However, the presence of such untrained subnetworks in graph neural networks (GNNs) still remains mysterious. In this paper we carry out the first-of-its-kind exploration of discovering matching untrained GNNs. With sparsity as the core tool, we can find untrained sparse subnetworks at the initialization, that can match the performance of fully trained dense GNNs. Besides this already encouraging finding of comparable performance, we show that the found untrained subnetworks can substantially mitigate the GNN over-smoothing problem, hence becoming a powerful tool to enable deeper GNNs without bells and whistles. We also observe that such sparse untrained subnetworks have appealing performance in out-of-distribution detection and robustness of input perturbations. We evaluate our method across widely-used GNN architectures on various popular datasets including the Open Graph Benchmark (OGB). The code is available at.
Benchmark Results
Tested on 7 datasets Non-standard metric on 1 dataset
Tables show presented results in global context (best 3 papers + GCN + MLP).
Classic
| # | Model | Accuracy ↑ | Paper |
|---|---|---|---|
| 1 | GraphSAGE+CNA | 0.9418
±0.0033 | |
| 2 | GCN+CNA | 0.9366
±0.0048 | |
| 3 | TransformerConv | 0.9350
±0.0058 | |
| 21 | GCN | 0.9004 | |
| 724 | MLP | 0.7768 | |
| 730 | UGTs-GCN | 0.7750
±0.0080 | This paper |
| 745 | UGTs-GAT | 0.7670
±0.0110 | This paper |
| 813 | NodeNorm | 0.7090 | This paper |
| 924 | Residual | 0.2070 | This paper |
| 925 | Trained Dense GAT | 0.2060 | This paper |
| # | Model | Accuracy ↑ | Paper |
|---|---|---|---|
| 1 | CNA | 0.9575
±0.0058 | |
| 2 | IS-GIB | 0.9390
±0.0187 | |
| 3 | EERM | 0.9112
±0.0145 | |
| 44 | GCN | 0.8033
±0.0088 | |
| 350 | MLP | 0.7289
±0.0010 | |
| 809 | UGTs-GAT | 0.6270
±0.0070 | This paper |
| 822 | UGTs-GCN | 0.6110
±0.0090 | This paper |
| 901 | Trained Dense GAT | 0.2000 | This paper |
| # | Model | Accuracy ↑ | Paper |
|---|---|---|---|
| 1 | LGTL | 0.9518
±0.0011 | |
| 2 | MixHop (LO) | 0.9513
±0.0038 | |
| 3 | GraphSAGE (LO) | 0.9511
±0.0036 | |
| 18 | GCN | 0.9296
±0.0015 | |
| 210 | MLP | 0.8690
±0.0074 | |
| 692 | UGTs-GAT | 0.7790
±0.0050 | This paper |
| 708 | UGTs-GCN | 0.7760
±0.0090 | This paper |
| 887 | Trained Dense GAT | 0.1800 | This paper |
OGB
| # | Model | Accuracy ↑ | Paper |
|---|---|---|---|
| 1 | Jacobi | 0.8968 | |
| 2 | GPR | 0.8953 | |
| 3 | LEMP4HG | 0.8939 | |
| 4 | SAGE | 0.8933 | |
| 148 | UGTs | 0.7990 | This paper |
| 162 | DENSE | 0.7950 | This paper |
| 351 | MLP | 0.6605
±0.0020 |
| # | Model | ROC-AUC ↑ | Paper |
|---|---|---|---|
| 1 | Multi-RF Fusion with Multi-GNN Blending | 0.8476
±0.0002 | |
| 2 | HyperFusion | 0.8475
±0.0003 | |
| 3 | PAS+FPs | 0.8420
±0.0015 | |
| 9 | GatedGCN | 0.8090
±0.0160 | |
| 109 | GIN | 0.7780
±0.0182 | |
| 131 | DENSE | 0.7740 | This paper |
| 135 | UGTs | 0.7730 | This paper |
ogbg-molpcba
Global leaderboard →Sorted by ROC-AUC. Highlighted rows are from other papers.
| # | Model | ROC-AUC ↑ | Paper |
|---|---|---|---|
| 1 | PrunE | 0.8159
±0.0535 | |
| 2 | EGTAS | 0.7919
±0.0137 | |
| 3 | UGTs | 0.7840 | This paper |
| 4 | DENSE | 0.7830 | This paper |
| 12 | GIN | 0.7042
±0.0478 |
Heterophilic Graphs
| # | Model | Accuracy ↑ | Paper |
|---|---|---|---|
| 1 | P^2GNN | 0.9672
±0.0147 | |
| 2 | DoG | 0.9660
±0.0210 | |
| 3 | GPF-plus | 0.9583
±0.0419 | |
| 34 | MLP | 0.9230
±0.0070 | |
| 53 | GraphSAGE | 0.9000
±0.0365 | |
| 444 | UGTs | 0.6480 | This paper |
| 472 | DENSE | 0.6220 | This paper |