GADBench: Revisiting and Benchmarking Supervised Graph Anomaly Detection
Abstract
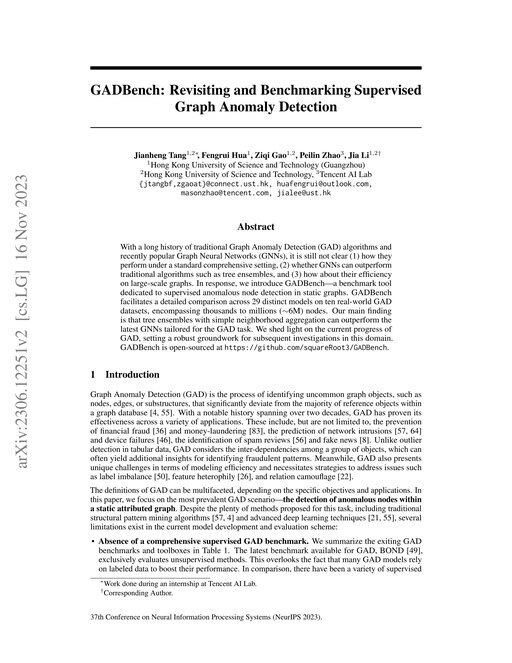
With a long history of traditional Graph Anomaly Detection (GAD) algorithms and recently popular Graph Neural Networks (GNNs), it is still not clear (1) how they perform under a standard comprehensive setting, (2) whether GNNs can outperform traditional algorithms such as tree ensembles, and (3) how about their efficiency on large-scale graphs. In response, we introduce GADBench---a benchmark tool dedicated to supervised anomalous node detection in static graphs. GADBench facilitates a detailed comparison across 29 distinct models on ten real-world GAD datasets, encompassing thousands to millions ($ $6M) nodes. Our main finding is that tree ensembles with simple neighborhood aggregation can outperform the latest GNNs tailored for the GAD task. We shed light on the current progress of GAD, setting a robust groundwork for subsequent investigations in this domain. GADBench is open-sourced at.
Benchmark Results
Tested on 2 datasets Non-standard metric on 2 datasets
Tables show presented results in global context (best 3 papers + GCN + MLP).
Classic
Sorted by AUPRC. Highlighted rows are from other papers.
| # | Model | AUPRC ↑ | Paper |
|---|---|---|---|
| 1 | BGNN | 0.0770
±0.0060 | This paper |
| 2 | XGBOD | 0.0750
±0.0140 | This paper |
| 3 | AMNet | 0.0730
±0.0100 | This paper |
| 4 | GHRN | 0.0720
±0.0170 | This paper |
| 5 | GAS | 0.0710
±0.0170 | This paper |
| 6 | BernNet | 0.0710
±0.0120 | This paper |
| 7 | BWGNN | 0.0690
±0.0160 | This paper |
| 8 | SVM | 0.0650
±0.0080 | This paper |
| 9 | GCN | 0.0650
±0.0140 | This paper |
| 11 | DCI | 0.0610
±0.0090 | This paper |
| 12 | GAT-sep | 0.0610
±0.0100 | This paper |
| 14 | MLP | 0.0600
±0.0110 | This paper |
| 15 | GAT | 0.0590
±0.0100 | This paper |
| 16 | NA | 0.0570
±0.0070 | This paper |
| 17 | GIN | 0.0570
±0.0090 | This paper |
| 18 | GT | 0.0570
±0.0090 | This paper |
| 19 | XGBoost | 0.0560
±0.0070 | This paper |
| 20 | XGB-Graph | 0.0560
±0.0050 | This paper |
| 21 | GraphSAGE | 0.0550
±0.0080 | This paper |
| 22 | PNA | 0.0540
±0.0040 | This paper |
| 23 | RF-Graph | 0.0540
±0.0040 | This paper |
| 24 | rf | 0.0530
±0.0060 | This paper |
| 25 | KNN | 0.0480
±0.0040 | This paper |
| 26 | SGC | 0.0460
±0.0080 | This paper |
| 29 | PCGNN | 0.0420
±0.0050 | This paper |
Other Graph Benchmarks
Amazon2M
Global leaderboard →Sorted by AUPRC. Highlighted rows are from other papers.
| # | Model | AUPRC ↑ | Paper |
|---|---|---|---|
| 1 | XGB-Graph | 0.9333 | This paper |
| 2 | XGBOD | 0.9215 | This paper |
| 3 | XGBoost | 0.9188 | This paper |
| 4 | NA | 0.9156 | This paper |
| 5 | BWGNN | 0.9148 | This paper |
| 6 | rf | 0.9118 | This paper |
| 7 | RF-Graph | 0.9053 | This paper |
| 8 | GHRN | 0.8952 | This paper |
| 9 | PCGNN | 0.8933 | This paper |
| 10 | AMNet | 0.8836 | This paper |
| 11 | GAT | 0.8794 | This paper |
| 12 | MLP | 0.8734 | This paper |
| 13 | SVM | 0.8580 | This paper |
| 14 | DCI | 0.8517 | This paper |
| 15 | GT | 0.8490 | This paper |
| 16 | BernNet | 0.8489 | This paper |
| 17 | GAT-sep | 0.8472 | This paper |
| 18 | GIN | 0.8461 | This paper |
| 19 | KNN | 0.8441 | This paper |
| 20 | GraphSAGE | 0.8245 | This paper |
| 21 | GAS | 0.8143 | This paper |
| 22 | BGNN | 0.6792 | This paper |
| 23 | GCN | 0.4565 | This paper |
| 24 | SGC | 0.4269 | This paper |
| 25 | PNA | 0.3524 | This paper |