Provable Filter for Real-world Graph Clustering
Abstract
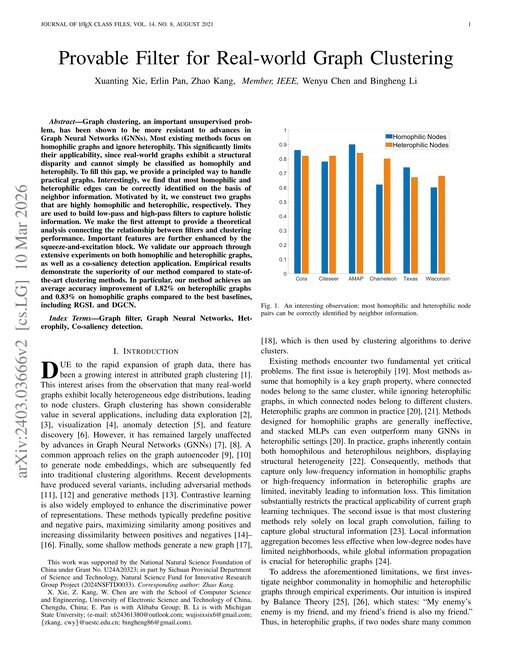
Graph clustering, an important unsupervised problem, has been shown to be more resistant to advances in Graph Neural Networks (GNNs). Most existing methods focus on homophilic graphs and ignore heterophily. This significantly limits their applicability, since real-world graphs exhibit a structural disparity and cannot simply be classified as homophily and heterophily. To fill this gap, we provide a principled way to handle practical graphs. Interestingly, we find that most homophilic and heterophilic edges can be correctly identified on the basis of neighbor information. Motivated by it, we construct two graphs that are highly homophilic and heterophilic, respectively. They are used to build low-pass and high-pass filters to capture holistic information. We make the first attempt to provide a theoretical analysis connecting the relationship between filters and clustering performance. Important features are further enhanced by the squeeze-and-excitation block. We validate our approach through extensive experiments on both homophilic and heterophilic graphs, as well as a co-saliency detection application. Empirical results demonstrate the superiority of our method compared to state-of-the-art clustering methods. In particular, our method achieves an average accuracy improvement of 1.82\
Benchmark Results
Tested on 4 datasets 1 baseline value reported too low Non-standard metric on 2 datasets
Tables show presented results in global context (best 3 papers + GCN + MLP).
Heterophilic Graphs
| # | Model | Accuracy ↑ | Paper |
|---|---|---|---|
| 1 | P^2GNN | 0.9541
±0.0272 | |
| 2 | ACM-GCN | 0.9480
±0.0380 | |
| 3 | RF-GCN | 0.9429 | |
| 24 | MLP | 0.9136
±0.0070 | |
| 138 | SAGE | 0.8269 | |
| 203 | DGCN | 0.7790
±0.0310 best reported | |
| 320 | two unsupervised strategies | 0.6612
±0.0075 | This paper |
| 391 | GMM | 0.5886 | This paper |
| 400 | RWR | 0.5829 | This paper |
| 405 | SELENE | 0.5796 | This paper |
| 411 | RGSL | 0.5744 | This paper |
| 424 | ARVGA | 0.5623 | This paper |
| 471 | CDC | 0.5140 | This paper |
| 472 | DCRN | 0.5132 | This paper |
| 481 | MSGA | 0.5077 | This paper |
| 530 | CGC | 0.4462 | prev best: CDC: A Simple Framework for Complex Data Clustering (2024) |
| 534 | FGC | 0.4410 | This paper |
| 546 | DAEGC | 0.4256 | This paper |
Heterophily Benchmark
| # | Model | Accuracy ↑ | Paper |
|---|---|---|---|
| 1 | Dir-Poly | 0.9451
±0.0022 | |
| 2 | D-CDE | 0.9387
±0.0041 | |
| 3 | LargeScaleNet | 0.9358
±0.0024 | |
| 26 | GraphSAGE | 0.9106
±0.0027 | |
| 135 | MLP | 0.6665
±0.0047 | |
| 201 | two unsupervised strategies | 0.3880
±0.0087 | This paper |
| 208 | RGSL | 0.3457 | This paper |
| 211 | DCRN | 0.3257 | This paper |
| 214 | CDC | 0.3102 | This paper |
| 215 | CGC | 0.3016 | This paper |
| 223 | DAEGC | 0.2123 | This paper |
| 225 | MSGA | 0.1931 | This paper |
| 227 | FGC | 0.1446 | This paper |
Hypergraph Benchmarks
AMAP
Global leaderboard →Default metric is Accuracy. The paper reports 0 values on Accuracy , 13 values on ACC and 11 values on NMI .
Sorted by ACC. Highlighted rows are from other papers.
| # | Model | Accuracy ↑ default | ACC ↑ | NMI ↑ | Paper |
|---|---|---|---|---|---|
| 1 | DCRN | — | 0.7994 | 0.7370 | Accuracy
— NMI
0.7370 |
| 2 | AMLP | 0.7980 | —
| — | Accuracy
0.7980 NMI
— |
| 3 | two unsupervised strategies | — | 0.7850
±
0.0045 | 0.7081
±
0.0074 | Accuracy
— NMI
0.7081
±
0.0074 |
| 4 | SCGC | — | 0.7748
±
0.0037 | 0.6767
±
0.0088 | Accuracy
— NMI
0.6767
±
0.0088 |
| 5 | CCGC | — | 0.7725
±
0.0041 | 0.6744
±
0.0048 | Accuracy
— NMI
0.6744
±
0.0048 |
| 6 | DFCN | — | 0.7688 | 0.6921 | Accuracy
— NMI
0.6921 |
| 8 | DGCN | — | 0.7607
±
0.0135 | 0.6613
±
0.0192 | Accuracy
— NMI
0.6613
±
0.0192 |
| 9 | AGE | — | 0.7598 | — | Accuracy
— NMI
— |
| 10 | CGC | — | 0.7302 | 0.6326 | Accuracy
— NMI
0.6326 |
| 11 | MCGC | — | 0.7164 | 0.6154 | Accuracy
— NMI
0.6154 |
| 12 | FGC | — | 0.7104 | — | Accuracy
— NMI
— |
| 13 | SSGC | — | 0.6023 | 0.6037 | Accuracy
— NMI
0.6037 |
| 14 | SDCN | — | 0.5344 | 0.4485 | Accuracy
— NMI
0.4485 |
| 15 | MVGRL | — | 0.4519 | 0.3689 | Accuracy
— NMI
0.3689 |
UAT
Global leaderboard →Default metric is F1. The paper reports 0 values on F1 , 12 values on ACC and 12 values on NMI .
Sorted by ACC. Highlighted rows are from other papers.
| # | Model | F1 ↑ default | ACC ↑ | NMI ↑ | Paper |
|---|---|---|---|---|---|
| 1 | AGCN | 0.6084 | —
| — | |
| 2 | the idea | 0.5840 | —
| — | |
| 3 | two unsupervised strategies | — | 0.5681
±
0.0034 | 0.2933
±
0.0042 | F1
— NMI
0.2933
±
0.0042 |
| 4 | SCGC | — | 0.5658
±
0.0162 | 0.2807
±
0.0071 | F1
— NMI
0.2807
±
0.0071 |
| 5 | CCGC | — | 0.5634
±
0.0111 | 0.2815
±
0.0192 | F1
— NMI
0.2815
±
0.0192 |
| 6 | FGC | — | 0.5303 | 0.2706 | F1
— NMI
0.2706 |
| 7 | AGE | — | 0.5237 | 0.2364 | F1
— NMI
0.2364 |
| 8 | DGCN | — | 0.5227
±
0.0045 | 0.2354
±
0.0038 | F1
— NMI
0.2354
±
0.0038 |
| 9 | SDCN | — | 0.5225 | 0.2161 | F1
— NMI
0.2161 |
| 11 | CGC | — | 0.4958 | 0.1749 | F1
— NMI
0.1749 |
| 12 | MVGRL | — | 0.4416 | 0.2153 | F1
— NMI
0.2153 |
| 13 | MCGC | — | 0.4193 | 0.1664 | F1
— NMI
0.1664 |
| 14 | SSGC | — | 0.3674 | 0.0804 | F1
— NMI
0.0804 |
| 15 | DFCN | — | 0.3361 | 0.2649 | F1
— NMI
0.2649 |