How Interpretable Are Interpretable Graph Neural Networks?
Abstract
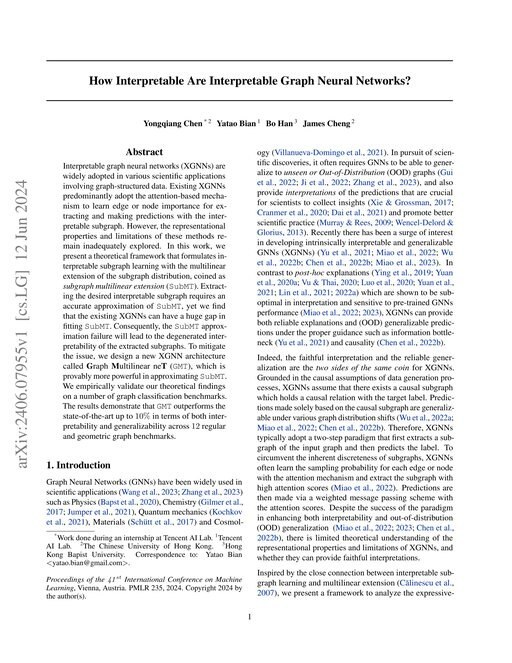
Interpretable graph neural networks (XGNNs) are widely adopted in various scientific applications involving graph-structured data. Existing XGNNs predominantly adopt the attention-based mechanism to learn edge or node importance for extracting and making predictions with the interpretable subgraph. However, the representational properties and limitations of these methods remain inadequately explored. In this work, we present a theoretical framework that formulates interpretable subgraph learning with the multilinear extension of the subgraph distribution, coined as subgraph multilinear extension (SubMT). Extracting the desired interpretable subgraph requires an accurate approximation of SubMT, yet we find that the existing XGNNs can have a huge gap in fitting SubMT. Consequently, the SubMT approximation failure will lead to the degenerated interpretability of the extracted subgraphs. To mitigate the issue, we design a new XGNN architecture called Graph Multilinear neT (GMT), which is provably more powerful in approximating SubMT. We empirically validate our theoretical findings on a number of graph classification benchmarks. The results demonstrate that GMT outperforms the state-of-the-art up to 10% in terms of both interpretability and generalizability across 12 regular and geometric graph benchmarks.
Benchmark Results
Tested on 6 datasets Non-standard metric on 1 dataset
Tables show presented results in global context (best 3 papers + GCN + MLP).
Classic
| # | Model | Accuracy ↑ | Paper |
|---|---|---|---|
| 1 | CNA | 0.9575
±0.0058 | |
| 2 | IS-GIB | 0.9390
±0.0187 | |
| 3 | EERM | 0.9112
±0.0145 | |
| 19 | GMT-lin | 0.8152
±0.0075 | This paper |
| 27 | SunnyGNN | 0.8128
±0.0075 | This paper |
| 29 | GSAT | 0.8114
±0.0051 | This paper |
| 37 | GMT-sam | 0.8076
±0.0097 | This paper |
| 44 | GCN | 0.8033
±0.0088 | |
| 350 | MLP | 0.7289
±0.0010 |
PubMed
Global leaderboard →Default metric is Accuracy. The paper reports 3 values on Accuracy and 1 value on Prediction Acc. .
| # | Model | Accuracy ↑ default | Prediction Acc. ↑ | Paper |
|---|---|---|---|---|
| 1 | LGTL | 0.9518
±
0.0011 | — | |
| 2 | MixHop (LO) | 0.9513
±
0.0038 | — | |
| 3 | GraphSAGE (LO) | 0.9511
±
0.0036 | — | |
| 18 | GCN | 0.9296
±
0.0015 | — | |
| 210 | MLP | 0.8690
±
0.0074 | — | Prediction Acc.
— |
| 849 | GMT-lin | 0.6856
±
0.0111 | — | Prediction Acc.
— |
| 852 | GSAT | 0.6818
±
0.0123 | — | Prediction Acc.
— |
| 853 | GMT-sam | —
| 0.6802
±
0.0066 | Prediction Acc.
0.6802
±
0.0066 |
| 855 | SunnyGNN | 0.6744
±
0.0207 | — | Prediction Acc.
— |
Coauthor-Physics
Global leaderboard →Default metric is Accuracy. The paper reports 1 value on Accuracy and 3 values on Prediction Acc. .
| # | Model | Accuracy ↑ default | Prediction Acc. ↑ | Paper |
|---|---|---|---|---|
| 1 | GrokFormer | 0.9831
±
0.0018 | — | Prediction Acc.
— |
| 2 | PolyFormer | 0.9808
±
0.0027 | — | Prediction Acc.
— |
| 3 | SGFormer | 0.9796
±
0.0081 | — | Prediction Acc.
— |
| 9 | GCN | 0.9774
±
0.0035 | — | Prediction Acc.
— |
| 58 | MLP | 0.9597
±
0.0007 | — | |
| 247 | GSAT | —
| 0.9268
±
0.0050 | Prediction Acc.
0.9268
±
0.0050 |
| 251 | SunnyGNN | 0.9258
±
0.0026 | — | Prediction Acc.
— |
| 252 | GMT-sam | —
| 0.9258
±
0.0035 | Prediction Acc.
0.9258
±
0.0035 |
| 253 | GMT-lin | —
| 0.9254
±
0.0045 | Prediction Acc.
0.9254
±
0.0045 |
Coauthor-CS
Global leaderboard →Default metric is Accuracy. The paper reports 1 value on Accuracy and 3 values on Prediction Acc. .
| # | Model | Accuracy ↑ default | Prediction Acc. ↑ | Paper |
|---|---|---|---|---|
| 1 | DoG | 0.9690
±
0.0030 | — | |
| 2 | GWN-fa | 0.9667
±
0.0026 | — | Prediction Acc.
— |
| 3 | GWN-sym | 0.9666
±
0.0026 | — | Prediction Acc.
— |
| 6 | GraphSAGE | 0.9593
±
0.0025 | — | Prediction Acc.
— |
| 88 | MLP | 0.9280
±
0.0020 | — | |
| 184 | GMT-lin | —
| 0.8566
±
0.0060 | Prediction Acc.
0.8566
±
0.0060 |
| 184 | GSAT | —
| 0.8530
±
0.0065 | Prediction Acc.
0.8530
±
0.0065 |
| 189 | GMT-sam | —
| 0.8422
±
0.0100 | Prediction Acc.
0.8422
±
0.0100 |
| 192 | SunnyGNN | 0.7710
±
0.0046 | — | Prediction Acc.
— |
TU Dortmund
MUTAG
Global leaderboard →Sorted by AUC. Highlighted rows are from other papers.
| # | Model | AUC ↑ | Paper |
|---|---|---|---|
| 1 | MoCL-DK-G(CL) | 0.9690 | |
| 2 | MoCL+AttrMask-G(CL) | 0.9620 | |
| 3 | MoCL-DK | 0.9500 | |
| 8 | IB-Subgraph | 0.9104
±0.0659 | This paper |
| 14 | DIR | 0.6444
±0.2881 | This paper |
| 15 | GraphMask | 0.6223
±0.0901 | This paper |
| 17 | GNNExplainer | 0.6198
±0.0545 | This paper |
| 18 | PGExplainer | 0.6091
±0.1710 | This paper |
OGB
ogbg-molhiv
Global leaderboard →Default metric is ROC-AUC. The paper reports 3 values on ROC-AUC and 4 values on AUC (MolHiv column) .
| # | Model | ROC-AUC ↑ default | AUC (MolHiv column) ↑ | Paper |
|---|---|---|---|---|
| 1 | Multi-RF Fusion with Multi-GNN Blending | 0.8476
±
0.0002 | — | AUC (MolHiv column)
— |
| 2 | HyperFusion | 0.8475
±
0.0003 | — | AUC (MolHiv column)
— |
| 3 | PAS+FPs | 0.8420
±
0.0015 | — | AUC (MolHiv column)
— |
| 9 | GatedGCN | 0.8090
±
0.0160 | — | AUC (MolHiv column)
— |
| 62 | PNA | 0.7905
±0.0132 best reported | — | AUC (MolHiv column)
— best at pub: Parameterized Hypercomplex Graph Neural Networks for Graph Classification (2021) best today: SigGate-GT: Taming Over-Smoothing in Graph Transformers via Sigmoid-Gated Attention (2026) Difference within reported uncertainty; not counted as underperformance. |
| 138 | GMT-sam | —
| 0.7722
±
0.0093 | AUC (MolHiv column)
0.7722
±
0.0093 |
| 152 | DIR | 0.7705 best reported | — | AUC (MolHiv column)
— best at pub: Discovering Invariant Rationales for Graph Neural Networks (ICLR 2022) best today: Generative Risk Minimization for Out-of-Distribution Generalization on Graphs (TMLR 2025) Difference within reported uncertainty; not counted as underperformance. |
| 160 | GraphSAGE | 0.7690
±
0.0136 | — | AUC (MolHiv column)
— |
| 163 | GMT-lin | —
| 0.7687
±
0.0112 | AUC (MolHiv column)
0.7687
±
0.0112 |
| 109 | GIN | —
| 0.7669
±
0.0125 | AUC (MolHiv column)
0.7669
±
0.0125 |
| 181 | IB-Subgraph | 0.7643
±
0.0265 | — | AUC (MolHiv column)
— |
| 24 | GSAT | —
| 0.7612
±
0.0091 | AUC (MolHiv column)
0.7612
±
0.0091 |