City-Networks
Abstract
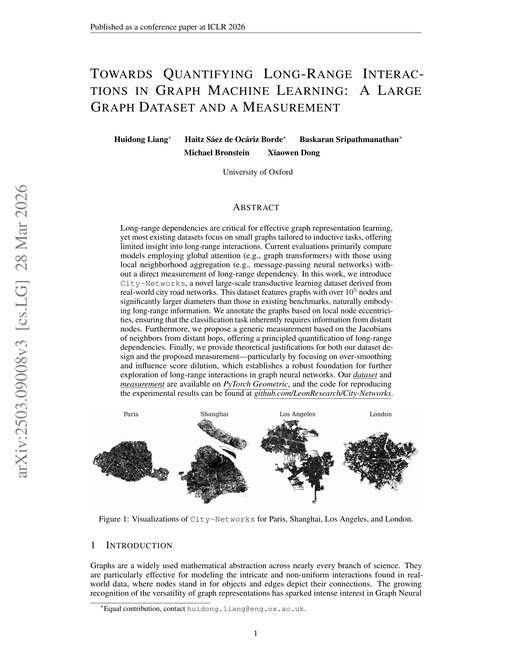
Long-range dependencies are critical for effective graph representation learning, yet most existing datasets focus on small graphs tailored to inductive tasks, offering limited insight into long-range interactions. Current evaluations primarily compare models employing global attention (e.g., graph transformers) with those using local neighborhood aggregation (e.g., message-passing neural networks) without a direct measurement of long-range dependency. In this work, we introduce City-Networks, a novel large-scale transductive learning dataset derived from real-world city road networks. This dataset features graphs with over $10^5$ nodes and significantly larger diameters than those in existing benchmarks, naturally embodying long-range information. We annotate the graphs based on local node eccentricities, ensuring that the classification task inherently requires information from distant nodes. Furthermore, we propose a generic measurement based on the Jacobians of neighbors from distant hops, offering a principled quantification of long-range dependencies. Finally, we provide theoretical justifications for both our dataset design and the proposed measurement—particularly by focusing on over-smoothing and influence score dilution, which establishes a robust foundation for further exploration of long-range interactions in graph neural networks. Our and are available on, and the code for reproducing the experimental results can be found at.
Benchmark Results
Tested on 4 datasets
Tables show presented results in global context (best 3 papers + GCN + MLP).
City-Networks
| # | Model | Accuracy ↑ | Paper |
|---|---|---|---|
| 1 | GAT | 0.5583
±0.0042 best reported | best today: k-Maximum Inner Product Attention for Graph Transformers and the Expressive Power of GraphGPS (ICLR 2026) |
| 2 | Exphormer | 0.5510
±0.0080 | This paper |
| 3 | GraphSAGE | 0.5460
±0.0020 | This paper |
| 4 | ChebNet | 0.5410
±0.0020 | This paper |
| 10 | GCN | 0.5320
±0.0030 | This paper |
| 11 | GraphGPS | 0.5210
±0.0060 | This paper |
| 12 | SGFormer | 0.5200
±0.0080 | This paper |
| 13 | GCNII | 0.5130
±0.0020 | This paper |
| 14 | DropEdge | 0.4820
±0.0020 | This paper |
| 15 | MLP | 0.2550
±0.0040 | This paper |
| # | Model | Accuracy ↑ | Paper |
|---|---|---|---|
| 1 | GAT | 0.7253
±0.0023 best reported | best today: k-Maximum Inner Product Attention for Graph Transformers and the Expressive Power of GraphGPS (ICLR 2026) |
| 2 | Exphormer | 0.7020
±0.0040 | This paper |
| 3 | GatedGCN | 0.6880
±0.0021 | |
| 4 | GraphSAGE | 0.6830
±0.0050 | This paper |
| 7 | ChebNet | 0.6650
±0.0010 | This paper |
| 9 | SGFormer | 0.6410
±0.0030 | This paper |
| 11 | GraphGPS | 0.6300
±0.0050 | This paper |
| 12 | GCN | 0.6210
±0.0020 | This paper |
| 13 | GCNII | 0.6150
±0.0040 | This paper |
| 14 | DropEdge | 0.6080
±0.0040 | This paper |
| 15 | MLP | 0.2840
±0.0060 | This paper |
| # | Model | Accuracy ↑ | Paper |
|---|---|---|---|
| 1 | GatedGCN | 0.6147
±0.0014 | |
| 2 | GINE | 0.5760
±0.0020 | |
| 3 | GAT | 0.5719
±0.0109 best reported | best today: k-Maximum Inner Product Attention for Graph Transformers and the Expressive Power of GraphGPS (ICLR 2026) |
| 5 | GraphSAGE | 0.5540
±0.0020 | This paper |
| 6 | GCN | 0.5525
±0.0006 best reported | best today: k-Maximum Inner Product Attention for Graph Transformers and the Expressive Power of GraphGPS (ICLR 2026) |
| 7 | ChebNet | 0.5470
±0.0020 | This paper |
| 9 | Exphormer | 0.4950
±0.0040 | This paper |
| 10 | SGFormer | 0.4830
±0.0030 | This paper |
| 11 | GCNII | 0.4820
±0.0030 | This paper |
| 12 | DropEdge | 0.4500
±0.0030 | This paper |
| 13 | MLP | 0.2790
±0.0010 | This paper |
| # | Model | Accuracy ↑ | Paper |
|---|---|---|---|
| 1 | Exphormer | 0.6380
±0.0060 | This paper |
| 2 | ChebNet | 0.6140
±0.0040 | This paper |
| 3 | GraphSAGE | 0.6140
±0.0030 | This paper |
| 4 | SGFormer | 0.6010
±0.0070 | This paper |
| 5 | GraphGPS | 0.5980
±0.0050 | This paper |
| 6 | GAT | 0.5950
±0.0030 | This paper |
| 7 | GCN | 0.5830
±0.0030 | This paper |
| 8 | GCNII | 0.5600
±0.0030 | This paper |
| 9 | DropEdge | 0.5550
±0.0030 | This paper |
| 10 | MLP | 0.2410
±0.0050 | This paper |