GraphNetz: Statistical Benchmarking of Graph Neural Networks with Paired Tests and Rank Aggregation
Abstract
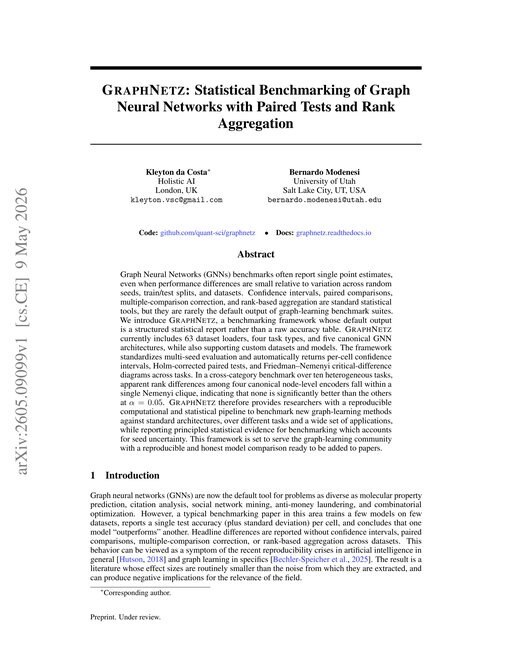
Graph Neural Networks (GNNs) benchmarks often report single point estimates, even when performance differences are small relative to variation across random seeds, train/test splits, and datasets. Confidence intervals, paired comparisons, multiple-comparison correction, and rank-based aggregation are standard statistical tools, but they are rarely the default output of graph-learning benchmark suites. We introduce GraphNetz, a benchmarking framework whose default output is a structured statistical report rather than a raw accuracy table. GraphNetz currently includes 63 dataset loaders, four task types, and five canonical GNN architectures, while also supporting custom datasets and models. The framework standardizes multi-seed evaluation and automatically returns per-cell confidence intervals, Holm-corrected paired tests, and Friedman–Nemenyi critical-difference diagrams across tasks. In a cross-category benchmark over ten heterogeneous tasks, apparent rank differences among four canonical node-level encoders fall within a single Nemenyi clique, indicating that none is significantly better than the others at $ = 0.05$. GraphNetz therefore provides researchers with a reproducible computational and statistical pipeline to benchmark new graph-learning methods against standard architectures, over different tasks and a wide set of applications, while reporting principled statistical evidence for benchmarking which accounts for seed uncertainty. This framework is set to serve the graph-learning community with a reproducible and honest model comparison ready to be added to papers.
Benchmark Results
Tested on 1 dataset Non-standard metric on 1 dataset
Tables show presented results in global context (best 3 papers + GCN + MLP).
Knowledge Graphs
FB15k-237
Global leaderboard →Sorted by AUC. Highlighted rows are from other papers.
| # | Model | AUC ↑ | Paper |
|---|---|---|---|
| 1 | GCN | 0.6740
±0.0090 | This paper |
| 2 | SAGE | 0.6330
±0.0440 | This paper |
| 3 | GT | 0.5380
±0.0120 | This paper |
| 4 | GAT | 0.5280
±0.0070 | This paper |